Land water resources and their distribution on the planet. Water supply of the countries of the world. World fresh water market
Not all countries can boast that they have a river basin at their disposal, which does not need to be shared with other states. There are countries that are best provided with water resources, and there are those where there is already an acute shortage of drinking water. Why is an independent position important?
The following example will help you understand the situation better. The Irtysh is the largest tributary of the Ob River. Its source is located on the Mongolian-Chinese border, then the Irtysh crosses China.
The length of the river in Chinese territory is five hundred kilometers. After that, it flows through Kazakhstan (more than 1700 km long) and then crosses the border of Russia, where the distance to the confluence with the Ob is almost 2000 km.
Earlier, there was an agreement between the countries on the division of the Irtysh flow. According to it, half (and this is about two billion cubic km of water) is taken by China, and half of the remaining flow is taken by Kazakhstan. This cannot but affect the full flow of the river in the section belonging to Russia.
If the river flowed through the territory of only one state, its water supply would not depend on how honestly the neighboring country acts. When several states participate in the division of a resource, things may not be very good.
If you look at the map of the world, it clearly shows which countries the rivers flow through, and which of them depend (or do not depend) on their neighbors. There are many more states sharing the water resource. Because of this, they are almost completely dependent on water supplies:
- Egypt, Turkmenistan, Kuwait - from 95 to 100%.
- Bangladesh, Moldova, Mauritania, Hungary - from 90 to 95%.
- Netherlands, Niger - 86–88%.
Among the countries of the post-Soviet space, water dependence is as follows:
- Turkmenistan and Moldova - more than 90%.
- Azerbaijan, Uzbekistan - about 75%.
- Ukraine, Latvia - more than 52%.
- Lithuania, Belarus, Tajikistan - from 31 to 37%.
- Tajikistan, Armenia - more than 31%.
- Russia, Estonia - less than 5%.
- Kyrgyzstan is completely independent.
If we compare water resources in terms of reserves, there are states that occupy leading positions.
| The name of the country | Volume of water reserves (cubic km) | Share of transboundary flow (%) |
| Brazil | 8.3 thousand | 34,1 |
| Russia | 4.6 thousand | 4,3 |
| USA | 3.1 thousand | 3,9 |
| Canada | 2.9 thousand | 1,9 |
| Indonesia | 2,7 | 0 |
| China | 2,6 | 0,6 |
| Colombia | 2,2 | 0,8 |
Peru, Venezuela, Burma and many other states may not fear that they will be threatened by a decrease in transboundary flow.
Changes in the use of river waters
Water is needed not only for drinking and irrigation: rivers serve as transport arteries, which is very important in places where it is impossible to build highways. In addition, rivers can be a place for fishing and recreation for people, a means for generating electricity.
All is well when the rivers are all right. But this is not always possible. For example, water arteries can carry pollutants from upstream countries to downstream countries.
Due to the deterioration of the quality of river water, not only people, but also land can suffer. Vegetation, animals, birds begin to die on the banks of polluted rivers.
First of all, trees that grow near the coast die. But this does not mean that forests located remotely will not be affected. Pollution will spread either over the soil surface (during spring-autumn floods) or in its depths (by groundwater).
Significant changes in the volume or quality of river flow can result from:
- To a change in agricultural activities and the inability to use land resources. The lack of water or the inability to use it for watering plants due to pollution will make it impossible to grow many crops for food or industry. In addition, water problems can lead to pasture drought. And the lack of animal feed will force the number of livestock to be reduced or completely destroyed. All this can eventually lead to food shortages due to the impossibility of full land use. This situation can be observed in many countries where there are no rivers.
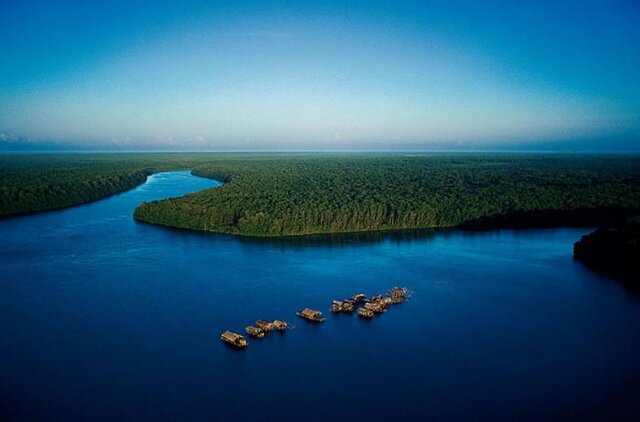
- To the death of forests. Forests occupy 30% of the land. In the north, coniferous species predominate, in the southern belts - tropical. Many of them grow near rivers. One such example is Brazil. More than 60 rivers flow in the vastness of this country, among which is the longest Amazon in the world. The territory of the state is covered with dense vegetation - tropical forests. Without the right amount of moisture, in particular, rivers, it is unlikely that the forests would be so dense. And Brazil, like other countries endowed with forest resources, occupies a leading position in terms of water reserves.
- To global climate or environmental changes. The death of fish and animals is only part of what awaits polluted or depleted rivers. Due to the lack of water, their banks turn into a swamp, the floodplains dry up. If polluted rivers flow through settlements, the ecological situation in them deteriorates sharply.
Conclusion: today the world economy faces an acute problem that needs to be solved as soon as possible. It concerns the rational use of water, especially fresh water. It just seems that there is a lot of water on the planet.
In fact, the picture is as follows:
- 96% of the planet's waters are in the oceans.
- Groundwater - 2%.
- Glaciers contain less than 2%.
- Surface water (fresh) is about 0.03% of the total. These include river, lake and swamp waters.
If we take into account the entire volume of water, then only 0.6 percent of them is fresh water. Every year, humanity uses more than 3.5 thousand cubic meters. km of water. This number includes used for the needs of agriculture (about 66%) and for industry (more than 20%). The water of the oceans is not used either for technical needs or for drinking.
World Ocean
The oceans of the Earth contain 96% of the water reserves that are used by all countries located on their shores. Accordingly, the reserves of the World Ocean are very important for the development of the productive forces of states.
The world ocean contains:
- Bioresources. These are phyto- and zooplankton, fish.
- Mineral raw materials. Moreover, at the bottom of the oceans, minerals are found in large quantities.
- Fresh water is a valuable resource that is becoming increasingly scarce. It is obtained by desalination.
In addition, the waters of the oceans:
- They are transport links.
- Represent energy potential.
- They purify the substances of various origin entering them.
If humanity can fully develop the resources of the planet's oceans, it will be able to solve many problems that are currently global.
Already today, the resources of the ocean shelves are widely used. It's about oil production. Thus, 32% of the produced oil has offshore origin, in - more than 85%. But Australia in this regard is the least rich: it receives only 50% of oil from the ocean floor.
WATER RESOURCES, 2014, Volume 41, No. 3, p. 235-246
WATER RESOURCES AND REGIME OF WATER BODIES
UDC 556.18:338.439:628.1
WATER RESOURCES AND THE FOOD PROBLEM
A. P. Demin © 2014
Institute of Water Problems of the Russian Academy of Sciences 119333 Moscow, st. Gubkina, 3 [email protected] Received 13.06. 2012
The data on the volume of renewable water resources and the specific water supply of the countries with the most and least water resources are presented. Modern data on the volume of withdrawal of water resources, the area of irrigated land, and the population of the largest countries of the world are given. The measures taken by foreign countries to increase the availability of water resources for agriculture are shown. It was revealed that a further increase in the area of arable and irrigated land while maintaining existing technologies in agriculture is unacceptable. The role of land reclamation in ensuring the food security of Russia is shown.
Key words: renewable water resources, water supply, food security, water pollution, irrigated land, waste water, saline water, land reclamation.
DOI: 10.7868/S0321059614030055
According to various estimates, global renewable water resources range from 42,000 to 43,800 km3/year and are extremely unevenly distributed over the land, depending on the climatic and physical-geographical conditions of their formation. Most of the water resources (47%) are concentrated in the Americas, followed by Asia (32), Africa (10), Europe (6) and Australia with Oceania (5%). The countries most and least provided with renewable water resources are listed in Table. one.
To assess the state of water resources in countries and regions of the world, in addition to volume, two criteria are usually used: the specific water supply of the region, calculated as the provision of water resources per capita, and the degree of use of water resources, characterized by the ratio of total water consumption to renewable water resources. Provision of water resources per capita - from 90-100 thousand m3 / (person per year) and more in countries such as Canada, Iceland, Gabon, Suriname, to less than 10 m3 / (person year) in Kuwait . Of the large countries of the world, Russia is one of the few where the indicator of specific water supply is at a fairly high level.
According to the UN, the minimum required water consumption for the needs of agriculture, industry, energy and so-
storage of environmental equilibrium is assumed to be 1700 m3/(person per year). With a specific water supply of 1000-1700 m3, it is customary to speak of a state of water stress, at 500-1000 m3 - a shortage of water resources, and less than 500 m3 - an absolute water shortage. Today, ~700 million people in 43 countries live under water stress. With an annual water supply averaging 1200 m3/person, the Middle East is the region experiencing the most water stress in the world. Sub-Saharan Africa is generally well endowed with water, but has more water stressed countries than any other region in the world, nearly a quarter of its population is now under water stress, and part of this population is steadily growing .
The temporal variability of water availability is also extremely high. Combined with underdeveloped water storage infrastructure and poor protection of river basins, this variability puts millions of people at risk from droughts and floods. In countries where water availability is dependent on monsoons or short periods of rainfall, national averages give a distorted picture of real water availability. Huge territories in Asia receive a significant part
Table 1. Data on the most and least provided countries with renewable water resources
Country Volume of renewable water resources, km3/year Specific water supply, m3/person
Countries most endowed with water resources
Brazil 8233 31 795
Russia 4507 29642
Canada 2902 92662
Indonesia 2838 13381
China 2830 2245
Columbia 2132 50160
USA 2071 7153
Peru 1913 62973
India 1897 1249
Countries least endowed with water resources
Israel 1.67 245
Jordan 0.88 154
Libya 0.60 99
Mauritania 0.40 131
Cape Verde 0.30 578
Djibouti 0.30 366
Qatar 0.05 61
Malta 0.05 123
Gaza Strip 0.06 320
Bahrain 0.12 163
Kuwait 0.02 7
annual precipitation over a period of several weeks. This gives rise to the danger of short-term but intense flooding during these periods and prolonged drought during the rest of the year. The actual availability of water during the year depends not only on the amount of precipitation, but also on the water reserves in reservoirs, the volume of river runoff and replenishment of groundwater reserves.
In the middle of the twentieth century. the ratio of water consumption to renewable water resources was low (<10%) или умеренным (10-20%) в подавляющем большинстве регионов, где проживает более 75% населения Земли. Лишь в одном регионе - Северной Африке степень использования водных ресурсов превышала 40%. К концу ХХ в. ситуация кардинальным образом изменилась: в 1995 г. более 40% населения проживало в регионах с очень высокой (40-60%) и критически высокой (>60%) pressure on water resources.
The amount of water a person needs for drinking and domestic purposes is insignificant in relation to the volumes needed for food production. For drinking purposes, a person needs 2-4 liters of water per day, for domestic needs - 30-300 liters. A person needs 3,000 liters of water per day to grow the daily necessary food. In 2000, 65% of the world's fresh water consumption was accounted for by agriculture, 20% by industry, 10% by domestic utilities, and 5% by additional water losses due to evaporation from the surface of reservoirs. In the structure of non-returnable water consumption, the share of agriculture exceeded 84%.
IMPACT OF WATER SCARCITY ON AGRICULTURE
Over 50 years (1950-2000), water consumption by agriculture in the world increased by 1525 (64% of the total increase in water consumption), by industry - by 572, and by households - by 297 km3. Irrigated agriculture has the greatest impact on the depletion of the planet's water resources in agriculture. The question arises: how big is the trend of a further increase in the withdrawal of water resources due to the growing population of the planet and the need to provide it with food?
Currently, most of the population lives in developing countries. According to demographers, by 2030 the world population will approach 8 billion, and by 2050 it will exceed 9 billion people. In the coming decades, the population of the least developed and developing countries will grow. The depletion of water resources, the deterioration of water quality and the increase in its scarcity have little effect on population growth, but have an extremely negative impact on economic growth and the well-being of countries. As a result, the possibilities of solving the problem of water scarcity are decreasing, while population growth continues.
Currently, the main users of water on the planet are developing countries, especially Asian countries (~70% of the annual volume of water withdrawn from water bodies) (Table 2). Current indicators for water consumption, irrigated land, population are given according to FAO, Eurostat, OECD, CIS Statistical Committee (for 80 largest countries in the world in terms of water withdrawal by agriculture) . In some cases, materials from national publications were used
Table 2. Fresh water withdrawal for agriculture and area of irrigated land in the countries of the world in 2003-2007
No. Withdrawn Including agriculture, km3 Share of water intake by rural areas Population, mln. Volume of water withdrawn Area of irrigated land, mln ha Area of irrigated land per person, ha
Freshwater farming in the ob- rural
water, km3
brine water, % per 1 person, m3
1 India 761.0 688.0 90.4 1134.0 607 55.8 0.049
2 China 581.9 360.0 61.9 1329.1 271 54.5 0.041
3 USA 482.2 186.8 38.7 301.3 620 24.7 0.082
4 Pakistan 183.5 172.4 94.0 159.6 1080 18.2 0.114
5 Iran 95.0 86.0 90.5 71.5 1203 7.65 0.107
6 Indonesia 86.0 78.5 91.3 225.6 348 4.50 0.020
7 Philippines 79.0 65.6 83.0 88.7 740 1.88 0.021
8 Mexico 78.9 60.6 76.8 105.8 573 6.32 0.060
9 Egypt 69.3 59.3 85.6 74.0 806 3.42 0.046
10 Japan 83.4 56.2 67.4 127.8 440 2.59 0.020
11 Uzbekistan 60.0 54.0 90.0 27.1 1993 4.28 0.158
12 Iraq 66.0 52.0 78.8 28.5 1825 3.52 0.124
13 Thailand 57.3 51.8 90.4 66.0 785 5.00 0.076
14 Vietnam 75.0 51.1 68.1 85.2 599 3.00 0.035
15 Sudan 37.3 36.1 96.8 37.2 970 1.86 0.050
16 Turkey 45.0 34.0 75.6 70.6 482 4.85 0.069
17 Brazil 58.5 31.9 54.5 19.0 166 2.92 0.015
18 Bangladesh 35.9 31.5 87.7 142.6 221 4.73 0.033
19 Mnyama 33.2 32.6 98.2 49.6 659 1.84 0.037
20 Italy 58.0 28.8 49.7 59.6 483 2.75 0.046
21 Spain 33.8 24.5 72.5 45.3 540 3.78 0.083
22 Turkmenistan 25.0 24.0 96.0 6.7 3582 1.74 0.260
23 Afghanistan 23.2 22.8 98.3 28.4 804 3.20 0.113
24 Argentina 29.2 21.5 73.6 39.5 544 1.55 0.039
25 Russia 74.6 21.5 28.8 142.2 151 4.60 0.032
26 Saudi Arabia 23.7 20.8 87.8 25.2 827 1.62 0.064
statistics, water management and environmental organizations in some countries and cross-checked with various sources.
The main consumers of water among developing countries are India, China, Pakistan. In most countries of Asia, Africa, Latin America, 75-90 (in some - up to 98)% of the volume of annually used water falls on the agricultural sector and only 10-25% - on industry and utilities. However, in many of these countries, agriculture takes up the vast majority of the water resources used. So, In India, Pakistan, Iran, Indonesia, Uzbekistan, Thailand, Sudan, Myanmar and other countries
NOVITSKAYA NATALIA NIKOLAEVNA - 2007
Until relatively recently, water, like air, was considered one of the free gifts of nature, only in areas of artificial irrigation it always had a high price. Recently, the attitude towards land water resources has changed.
Over the past century, the consumption of fresh water in the world has doubled, and the planet's water resources do not meet such a rapid increase in human needs. According to the World Commission on Water, today every person needs 40 (20 to 50) liters of water daily for drinking, cooking and personal hygiene.
However, about a billion people in 28 countries around the world do not have access to so many vital resources. More than 40% of the world's population (about 2.5 billion people) lives in areas experiencing moderate or severe water scarcity.
It is assumed that by 2025 this number will increase to 5.5 billion and will amount to two-thirds of the world's population.
The vast majority of fresh water is, as it were, conserved in the glaciers of Antarctica, Greenland, in the ice of the Arctic, in mountain glaciers and forms a kind of "emergency reserve" that is not yet available for use.
Different countries differ greatly in fresh water reserves. Below is a ranking of countries with the largest fresh water resources in the world. However, this ranking is based on absolute figures and does not match per capita figures.
10. Myanmar

Per capita- 23.3 thousand cubic meters m
The rivers of Myanmar - Burma are subject to the monsoon climate of the country. They originate in the mountains, but do not feed on glaciers, but on precipitation.
More than 80% of the annual river nutrition is rain. In winter, the rivers become shallow, some of them, especially in central Burma, dry up.
There are few lakes in Myanmar; the largest of them is the tectonic lake Indoji in the north of the country with an area of 210 sq. km.
Despite the relatively high absolute figures, the inhabitants of some areas of Myanmar suffer from a shortage of fresh water.
9. Venezuela
Per capita- 60.3 thousand cubic meters. m
Nearly half of Venezuela's more than 1,000 rivers run off the Andes and the Guiana Plateau into the Orinoco, Latin America's third largest river. Its basin covers an area of about 1 million square meters. km. The Orinoco drainage basin occupies approximately four-fifths of the territory of Venezuela.
8. India
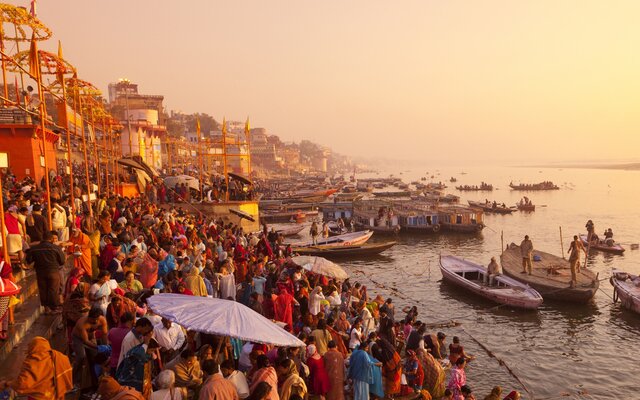
Per capita- 2.2 thousand cubic meters m
India has a large amount of water resources: rivers, glaciers, seas and oceans. The most significant rivers are: Ganges, Indus, Brahmaputra, Godavari, Krishna, Narbada, Mahanadi, Kaveri. Many of them are important as sources of irrigation.
Eternal snows and glaciers in India occupy about 40 thousand square meters. km of territory.
However, given India's huge population, the per capita supply of fresh water is quite low.
7. Bangladesh

Per capita- 19.6 thousand cubic meters. m
Bangladesh is one of the countries in the world with the highest population density. This is largely due to the extraordinary fertility of the Ganges Delta and regular floods caused by monsoon rains. However, overcrowding and poverty have become a real disaster for Bangladesh.
There are many rivers flowing through Bangladesh, and the floods of large rivers can last for weeks. Bangladesh has 58 transboundary rivers, and issues arising from the use of water resources are very sensitive in discussions with India.
However, despite the relatively high level of water resources, the country faces a problem: the water resources of Bangladesh are often subject to arsenic poisoning due to its high content in the soil. Up to 77 million people are exposed to arsenic poisoning through drinking contaminated water.
6. USA

Per capita- 2.4 thousand cubic meters. m
The United States occupies a vast territory, on which there are many rivers and lakes.
However, despite the fact that the United States has such fresh water resources, this does not save California from the worst drought in history.
In addition, given the high population of the country, the supply of fresh water per capita is not so high.
5. Indonesia

Per capita- 12.2 thousand cubic meters. m
The special relief of the territories of Indonesia, combined with a favorable climate, at one time contributed to the formation of a dense river network in these lands.
In the territories of Indonesia, a fairly large amount of precipitation falls all year round, because of this, the rivers are always full-flowing and play a significant role in the irrigation system.
Almost all of them flow from the Maoke Mountains north into the Pacific Ocean.
4. China

Per capita- 2.3 thousand cubic meters. m
China has 5-6% of the world's water reserves. But China is the most populous country in the world, and its water distribution is highly uneven.
The south of the country has been fighting for thousands of years and today is fighting floods, building and building dams to save crops and people's lives.
The north of the country and the central regions are suffering from lack of water.
3. Canada
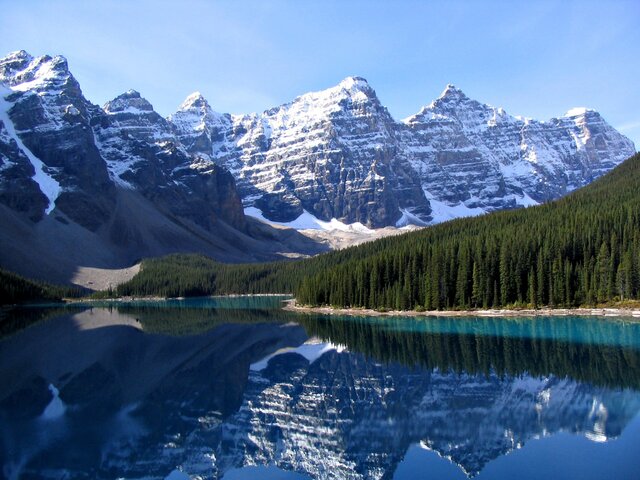
Per capita- 98.5 thousand cubic meters. m
Canada has 7% of the world's renewable fresh water resources and less than 1% of the world's total population. Accordingly, per capita income in Canada is one of the highest in the world.
Most of Canada's rivers belong to the basin of the Atlantic and Arctic Oceans, and much fewer rivers flow into the Pacific Ocean.
Canada is one of the richest countries in the world with lakes. On the border with the United States are the Great Lakes (Upper, Huron, Erie, Ontario), connected by small rivers into a huge basin of more than 240 thousand square meters. km.
Less significant lakes lie on the territory of the Canadian Shield (Great Bear, Great Slave, Athabasca, Winnipeg, Winnipegosis), etc.
2. Russia
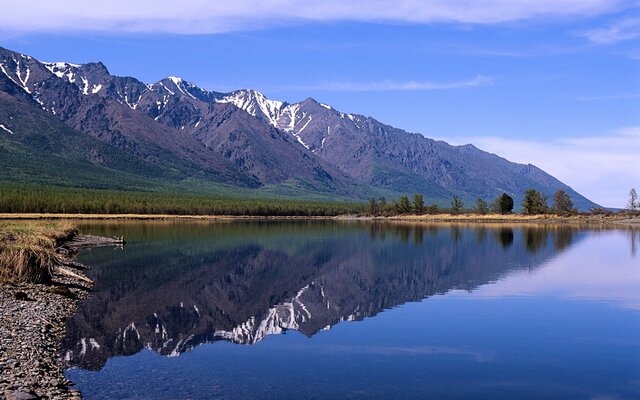
Per capita- 30.5 thousand cubic meters. m
In terms of reserves, Russia accounts for more than 20% of the world's fresh water resources (excluding glaciers and groundwater). In calculating the volume of fresh water per inhabitant of Russia, there are about 30 thousand cubic meters. m of river flow per year.
Russia is washed by the waters of 12 seas belonging to three oceans, as well as the inland Caspian Sea. On the territory of Russia there are over 2.5 million large and small rivers, more than 2 million lakes, hundreds of thousands of swamps and other objects of the water fund.
1. Brazil

Per capita- 43.0 thousand cubic meters m
The water resources of Brazil are represented by a huge number of rivers, the main of which is the Amazon (the greatest river in the world).
Almost a third of this large country is occupied by the Amazon River basin, which includes the Amazon itself and more than two hundred of its tributaries.
This gigantic system contains a fifth of all the river waters of the world.
The rivers and their tributaries flow slowly, during the rainy seasons they often overflow their banks and flood vast areas of tropical forests.
The rivers of the Brazilian Plateau have significant hydropower potential. The largest lakes in the country are Mirim and Patos. Main rivers: Amazon, Madeira, Rio Negro, Parana, Sao Francisco.
Date: 2016-04-07
Life on our planet originated from water, the human body is 75% water, so the issue of fresh water reserves on the planet is very important. After all, water is the source and stimulus of our life.
Fresh water is considered to be water that contains no more than 0.1% salt.
At what, no matter what state it is in: liquid, solid or gaseous.
World fresh water reserves
97.2% of the water that is on planet earth belongs to salty oceans and seas. And only 2.8% is fresh water. On the planet it is distributed as follows:
- 2.15% of the water reserves are frozen in the mountains, icebergs and ice sheets of Antarctica;
- 0.001% of water reserves are in the atmosphere;
- 0.65% of water reserves are in rivers and lakes.
From here it is taken by a person for his consumption.
In general, it is believed that the sources of fresh water are endless. Since the process of self-healing is constantly taking place as a result of the water cycle in nature. Every year, as a result of the evaporation of moisture from the oceans, a huge supply of fresh water (about 525,000 km3) is formed in the form of clouds.
A small part of it still ends up in the ocean, but most of it falls on the continents in the form of snow and rain, and then ends up in lakes, rivers and groundwater.
Fresh water consumption in different parts of the world
Even such a small percentage of available fresh water could cover all the needs of mankind if its reserves were evenly distributed over the planet, but this is not so.
The Food and Agriculture Organization of the United Nations (FAO) has identified several areas whose water consumption exceeds the amount of renewable water resources:
- Arabian Peninsula.
For public needs, five times more fresh water is used here than is available in available natural sources. Water is exported here with the help of tankers and pipelines, sea water desalination procedures are carried out.
- Under stress are water resources in Pakistan, Uzbekistan and Tajikistan.
Almost 100% of renewable water resources are consumed here. More than 70% of renewable water resources are produced by Iran.
- Fresh water problems also exist in North Africa, especially in Libya and Egypt. These countries use almost 50% of water resources.
The greatest need is experienced not by those countries where there are frequent droughts, but by those with a high population density.
World fresh water market
You can see this using the table below. For example, Asia has the largest area of water resources and Australia the smallest. But, at the same time, every inhabitant of Australia is provided with drinking water 14 times better than any inhabitant of Asia.
And all because the population of Asia is 3.7 billion, while only 30 million live in Australia.
Problems in the use of fresh water
Over the past 40 years, the amount of clean fresh water per person has decreased by 60%.
Agriculture is the biggest consumer of fresh water. Today, this sector of the economy consumes almost 85% of the total volume of fresh water used by humans. Products grown with artificial irrigation are much more expensive than those grown on soil and irrigated by rain.
More than 80 countries of the world are experiencing a shortage of fresh water.
And every day this problem is getting worse. Water scarcity even causes humanitarian and state conflicts. Improper use of groundwater leads to a decrease in their volume. These reserves are depleted annually from 0.1% to 0.3%. Moreover, in poor countries, 95% of the water cannot be used for drinking or food at all due to the high level of pollution.
The need for clean drinking water is increasing every year, but its quantity, on the contrary, is only decreasing.
Nearly 2 billion people have limited water intake. According to experts, by 2025, almost 50 countries of the world, where the number of inhabitants will exceed 3 billion people, will feel the problem of water shortage.
In China, despite high rainfall, half of the population does not have regular access to sufficient drinking water.
Groundwater, like the soil itself, is renewed too slowly (about 1% per year).
The issue of the greenhouse effect remains relevant. The climate of the Earth is constantly deteriorating due to the constant release of carbon dioxide into the atmosphere. This causes an anomalous redistribution of precipitation, the occurrence of droughts in countries where they should not be, snowfall in Africa, high frosts in Italy or Spain.
Such anomalous changes can cause a decrease in crop yields, an increase in plant diseases, and the reproduction of pest populations and various insects.
The planet's ecosystem is losing its stability and cannot adapt to such a rapid change in conditions.
Instead of totals
In the end, we can say that there are enough water resources on planet Earth. The main problem of water supply is that these reserves are unevenly distributed on the planet. Moreover, 3/4 of fresh water reserves are in the form of glaciers, which are very difficult to access.
Because of this, in some regions there is already a shortage of fresh water.
The second problem is the contamination of existing available water sources with human waste products (heavy metal salts, oil refinery products). Pure water that can be consumed without prior purification can only be found in remote ecologically clean areas. But densely populated regions, on the contrary, suffer from the inability to drink water from their meager reserves.
Back to Water Resources
The countries of the world are provided with water resources extremely unevenly.
The following countries are the most endowed with water resources: Brazil (8,233 km3), Russia (4,508 km3), USA (3,051 km3), Canada (2,902 km3), Indonesia (2,838 km3), China (2,830 km3), Colombia (2,132 km3), Peru (1,913 km3), India (1,880 km3), Congo (1,283 km3), Venezuela (1,233 km3), Bangladesh (1,211 km3), Burma (1,046 km3).
Most water resources per capita are in French Guiana (609,091 m3), Iceland (539,638 m3), Guyana (315,858 m3), Suriname (236,893 m3), Congo (230,125 m3), Papua New Guinea (121 788 m3), Gabon (113,260 m3), Bhutan (113,157 m3), Canada (87,255 m3), Norway (80,134 m3), New Zealand (77,305 m3), Peru (66,338 m3), Bolivia (64,215 m3), Liberia (61,165 m3), Chile (54,868 m3), Paraguay (53,863 m3), Laos (53,747 m3), Colombia (47,365 m3), Venezuela (43,8463), Panama (43,502 m3) , Brazil (42,866 m3), Uruguay (41,505 m3), Nicaragua (34,710 m3), Fiji (33,827 m3), Central African Republic (33,280 m3), Russia (31,833 m3).
The least per capita water resources are in Kuwait (6.85 m3), the United Arab Emirates (33.44 m3), Qatar (45.28 m3), the Bahamas (59.17 m3), Oman (91.63 m3), Saudi Arabia (95.23 m3), Libya (3,366.19 ft).
On average on Earth, each person has 24,646 m3 (24,650,000 liters) of water per year.
Few countries in the world rich in water resources can boast of having "at their disposal" river basins that are not separated by territorial boundaries. Why is it so important? Let's take for example the largest tributary of the Ob - the Irtysh (part of the flow of which they wanted to transfer to the Aral Sea). The source of the Irtysh is located on the border of Mongolia and China, then the river flows for more than 500 km through the territory of China, crosses the state border and flows through the territory of Kazakhstan for about 1800 km, then the Irtysh flows for about 2000 km through the territory of Russia until it flows into the Ob.
Which country owns 20% of all fresh water on earth?
Let's see how things stand with the strategic "water independence" in the world.
The map presented to your attention above illustrates the percentage of the volume of renewable water resources entering the country from the territory of neighboring states, of the total volume of the country's water resources (A country with a value of 0% does not "receive" water resources from the territories of neighboring countries at all; 100% - all water resources come from outside the state).
The map shows that the following states are the most dependent on the “supplies” of water from the territory of neighboring countries: Kuwait (100%), Turkmenistan (97.1%), Egypt (96.9%), Mauritania (96.5%) , Hungary (94.2%), Moldova (91.4%), Bangladesh (91.3%), Niger (89.6%), Netherlands (87.9%).
Now let's try to do some calculations, but first let's rank countries by water resources:
5.
10.
Congo (1,283 km3) - (Share of transboundary flow: 29.9%)
11. Venezuela (1,233 km3) - (Share of transboundary flow: 41.4%)
Now, based on these data, we will compile our rating of countries whose water resources are least dependent on the potential reduction in transboundary flow caused by water withdrawal by countries located upstream:
Brazil (5,417 km3)
2. Russia (4,314 km3)
3. Canada (2,850 km3)
4. Indonesia (2,838 km3)
5. China (2,813 km3)
6. USA (2,801 km3)
7. Colombia (2,113 km3)
8.
Peru (1,617 km3)
9. India (1,252 km3)
10. Burma (881 km3)
11. Congo (834 km3)
12. Venezuela (723 km3)
13.
Bangladesh (105 km3)
Below is a map of the world's fresh groundwater resources. Blue areas on the map are areas rich in groundwater, brown areas are areas where there is a shortage of groundwater.
In arid countries, water is almost completely taken from underground sources (Morocco - 75%, Tunisia - 95%, Saudi Arabia and Malta - 100%).
In Equatorial and South Africa, groundwater is doing much better. Torrential tropical rains contribute to the rapid restoration of groundwater reserves.
![]()
Recreational resources
The developed countries
Information Security
National security
Transport security
Back | | Up
©2009-2018 Financial Management Center.
All rights reserved. Publication of materials
allowed with the obligatory indication of a link to the site.
The countries of the world are provided with water resources extremely unevenly. The following countries are the most endowed with water resources: Brazil (8,233 km3), Russia (4,508 km3), USA (3,051 km3), Canada (2,902 km3), Indonesia (2,838 km3), China (2,830 km3), Colombia (2,132 km3), Peru (1,913 km3), India (1,880 km3), Congo (1,283 km3), Venezuela (1,233 km3), Bangladesh (1,211 km3), Burma (1,046 km3).
The volume of water resources per capita by country (m3 per year per capita)

Most water resources per capita are in French Guiana (), Iceland (), Guyana (), Suriname (), Congo (), Papua New Guinea (), Gabon (), Bhutan (), Canada (), Norway ( ), New Zealand (), Peru (), Bolivia (), Liberia (), Chile (), Paraguay (), Laos (), Colombia (), Venezuela (43 8463), Panama (), Brazil (), Uruguay (), Nicaragua (), Fiji (), Central African Republic (), Russia ().
Note!!!
The least water resources per capita are in Kuwait (), the United Arab Emirates (), Qatar (), the Bahamas (), Oman (), Saudi Arabia (), Libya ().
On average on Earth, each person has () water per year.
Share of transboundary runoff in the total annual runoff of the rivers of the countries of the world (in %)
Few countries in the world rich in water resources can boast of having "at their disposal" river basins that are not separated by territorial boundaries.
Why is it so important? Let's take for example the largest tributary of the Ob - the Irtysh (part of the flow of which they wanted to transfer to the Aral Sea).
The source of the Irtysh is located on the border of Mongolia and China, then the river flows through the territory of China for more, crosses the state border and flows around the territory of Kazakhstan, then the Irtysh flows around the territory of Russia until it flows into the Ob.
According to international agreements, China can take half of the annual flow of the Irtysh for its own needs, Kazakhstan - half of what remains after China. As a result, this can greatly affect the full flow of the Russian section of the Irtysh (including hydropower resources). At present, China annually deprives Russia of 2 billion km3 of water. Therefore, the water supply of each country in the future may depend on whether the sources of rivers or sections of their channels are outside the country.
Let's see how things stand with the strategic "water independence" in the world.
Share of transboundary runoff in the total annual runoff of rivers in the countries of the world

The map presented to your attention above illustrates the percentage of the volume of renewable water resources entering the country from the territory of neighboring states, of the total volume of the country's water resources (A country with a value of 0% does not "receive" water resources at all from the territories of neighboring countries; 100% - all water resources come from outside the state).
The map shows that the following states are the most dependent on "supplies" of water from the territory of neighboring countries: Kuwait (100%), Turkmenistan (97.1%), Egypt (96.9%), Mauritania (96.5%) , Hungary (94.2%), Moldova (91.4%), Bangladesh (91.3%), Niger (89.6%), Netherlands (87.9%).
In the post-Soviet space, the situation is as follows: Turkmenistan (97.1%), Moldova (91.4%), Uzbekistan (77.4%), Azerbaijan (76.6%), Ukraine (62%), Latvia (52. 8%), Belarus (35.9%), Lithuania (37.5%), Kazakhstan (31.2%), Tajikistan (16.7%) Armenia (11.7%), Georgia (8.2%) , Russia (4.3%), Estonia (0.8%), Kyrgyzstan (0%).
Now let's try to do some calculations, but first let's make rating of countries by water resources:
Brazil (8,233 km3) - (Share of transboundary flow: 34.2%)
2. Russia (4,508 km3) - (Share of transboundary flow: 4.3%)
3. USA (3,051 km3) - (Share of transboundary flow: 8.2%)
4. Canada (2,902 km3) - (Share of transboundary flow: 1.8%)
5.
Indonesia (2,838 km3) — (Share of transboundary flow: 0%)
6. China (2,830 km3) - (Share of transboundary flow: 0.6%)
7. Colombia (2,132 km3) - (Share of transboundary flow: 0.9%)
8. Peru (1,913 km3) - (Share of transboundary flow: 15.5%)
9. India (1,880 km3) - (Share of transboundary flow: 33.4%)
10. Congo (1,283 km3) - (Share of transboundary flow: 29.9%)
11.
Venezuela (1,233 km3) - (Share of transboundary flow: 41.4%)
12. Bangladesh (1,211 km3) - (Share of transboundary flow: 91.3%)
13. Burma (1,046 km3) - (Share of transboundary flow: 15.8%)
Now, based on these data, we will compile our rating of countries whose water resources are least dependent on the potential reduction in transboundary flow caused by water intake by countries located upstream.
Brazil (5,417 km3)
2. Russia (4,314 km3)
3. Canada (2,850 km3)
4. Indonesia (2,838 km3)
5. China (2,813 km3)
6.
USA (2,801 km3)
7. Colombia (2,113 km3)
8. Peru (1,617 km3)
9. India (1,252 km3)
10. Burma (881 km3)
11. Congo (834 km3)
12. Venezuela (723 km3)
13. Bangladesh (105 km3)
In conclusion, I would like to note that the use of river waters is not limited to water intake alone. We should also not forget about the transboundary transfer of pollutants, which can significantly worsen the quality of river waters in river sections located on the territory of other countries downstream.
Significant changes in river flow are caused by deforestation, agricultural activities, and global climate change.
Below is a map of the world's fresh groundwater resources.
Blue areas on the map are areas rich in groundwater, brown areas are areas where there is a shortage of groundwater.

Countries with large reserves of groundwater include Russia, Brazil, as well as a number of equatorial African countries.
Note!!!
The scarcity of clean, fresh surface water is forcing many countries to make greater use of groundwater.
In the European Union, already 70% of all water used by water users is taken from underground aquifers.
In arid countries, water is almost completely taken from underground sources (Morocco - 75%, Tunisia - 95%, Saudi Arabia and Malta - 100%)
Underground aquifers occur everywhere, but they are not renewable everywhere. So in North Africa and the Arabian Peninsula, they were filled with water about 10,000 years ago, when the climate here was more humid.
In Equatorial and South Africa, groundwater is doing much better.
Torrential tropical rains contribute to the rapid restoration of groundwater reserves.
19. World water resources
The concept of water resources can be interpreted in two senses - broad and narrow.
In a broad sense, this is the entire volume of hydrosphere water contained in rivers, lakes, glaciers, seas and oceans, as well as in underground horizons and in the atmosphere.
The definitions of huge, inexhaustible are quite applicable to it, and this is not surprising. After all, the World Ocean occupies 361 million km2 (about 71% of the total area of the planet), and glaciers, lakes, reservoirs, swamps, rivers account for another 20 million km2 (15%). As a result, the total volume of the hydrosphere is estimated at 1390 million km3. It is easy to calculate that with such a total volume, there is now approximately 210 million m3 of water per inhabitant of the Earth. This amount would be enough to supply a large city for a whole year!
However, it is necessary to take into account the possibilities of using these huge resources.
Indeed, out of the total volume of water contained in the hydrosphere, 96.4% falls on the share of the World Ocean, and of the land water bodies, the largest amount of water contains glaciers (1.86%) and groundwater (1.68%), the use of which is possible, but more partly very difficult.
That is why, when they talk about water resources in the narrow sense of the word, they mean usable fresh waters, which make up only 2.5% of the total volume of all waters in the hydrosphere.
However, significant adjustments have to be made to this indicator. It is impossible not to take into account the fact that almost all fresh water resources are “mothballed” either in the glaciers of Antarctica, Greenland, mountainous regions, in the ice of the Arctic, or in groundwater and ice, the use of which is still very limited.
Lakes and reservoirs are used much more widely, but their geographical distribution is by no means ubiquitous. It follows from this that the main source of meeting the needs of mankind in fresh water has been and remains river (channel) water, the share of which is extremely small, and the total volume is only 2100 km3.
Such an amount of fresh water would already be lacking for people to live.
However, due to the fact that the duration of the conditional moisture cycle for rivers is 16 days, during the year the volume of water in them is renewed on average 23 times and, therefore, the resources of river runoff can be estimated purely arithmetically at 48 thousand m3.
km3/year. However, the figure of 41 thousand km3/year prevails in the literature. It characterizes the “water ration” of the planet, but reservations are also needed here. It should be taken into account that more than half of the channel waters flow into the sea, so that the resources of such waters actually available for use, according to some estimates, do not exceed 15 thousand m3.
If we consider how the total river runoff is distributed among large regions of the world, it turns out that foreign Asia accounts for 11 thousand tons of water.
km3, to South America - 10.5, to North America - 7, to the CIS countries - 5.3, to Africa - 4.2, to Australia and Oceania - 1.6 and to foreign Europe - 1.4 thousand km3 . It is clear that behind these indicators are primarily the largest river systems in terms of runoff: in Asia - the Yangtze, the Ganges and the Brahmaputras, in South America - the Amazon, Orinoco, Parana, in North America - the Mississippi, in the CIS - the Yenisei, Lena, in Africa Kongo, Zambezi.
This fully applies not only to regions, but also to individual countries (Table 23).
Table 23
TOP TEN COUNTRIES BY FRESHWATER RESOURCES

The figures characterizing water resources cannot yet give a complete picture of water availability, since the provision with total runoff is usually expressed in specific indicators - either per 1 km2 of the territory, or per inhabitant.
Such a water supply of the world and its regions is shown in Figure 19. An analysis of this figure suggests that with an average world indicator of 8000 m3 / year, Australia and Oceania, South America, the CIS and North America have indicators above this level, and below - Africa, foreign Europe and overseas Asia.
This situation with the water supply of the regions is explained both by the total size of their water resources and by the size of their population. No less interesting is the analysis of differences in the water availability of individual countries (Table 24). Of the ten countries with the highest water availability, seven are within the equatorial, subequatorial and tropical zones, and only Canada, Norway and New Zealand are within the temperate and subarctic.

19. Availability of river runoff resources in major regions of the world, thousand m3/year
Table 24
COUNTRIES WITH THE HIGHEST AND LOWEST SUPPLY OF FRESHWATER RESOURCES

Although, according to the above per capita indicators of the water supply of the whole world, its individual regions and countries, it is quite possible to imagine its general picture, it would still be more correct to call such provision potential.
To imagine the real water supply, it is necessary to take into account the size of water intake, water consumption.
World water consumption in the twentieth century. increased as follows (in km3): 1900 - 580, 1940 - 820, 1950
- 1100, 1960 - 1900, 1970 - 2520, 1980 - 3200, 1990 - 3580, 2005 - 6000.
TOP-20 countries by fresh water reserves!
These general indicators of water consumption are very important: they indicate that during the 20th century. world water consumption increased by 6.8 times.
Already, almost 1.2 billion people do not have access to clean drinking water. According to the UN forecast, universal access to such water can be achieved: in Asia - by 2025, in Africa - by 2050. The structure, i.e. the nature of water consumption, is no less important. Today, 70% of fresh water is consumed by agriculture, 20% by industry, and 10% is used to meet household needs. This ratio is quite understandable and natural, but from the point of view of saving water resources, it is rather unprofitable, primarily because it is in agriculture (especially in irrigated agriculture) that irretrievable water consumption is very high.
According to the available calculations, in 2000 irretrievable water consumption in the world's agriculture amounted to 2.5 thousand km3, while in industry and public utilities, where recycling water supply is more widely used, only 65 and 12 km3, respectively. From all that has been said, it follows, firstly, that today humanity already uses a fairly significant part of the “water ration” of the planet (about 1/10 of the total and more than 1/4 of the actually available) and, secondly, that the irretrievable loss of water is more than 1/2 of its total consumption.
It is no coincidence that the highest rates of per capita water consumption are characteristic of countries with irrigated agriculture.
The record holder here is Turkmenistan (7000 m3 per person per year). It is followed by Uzbekistan, Kyrgyzstan, Kazakhstan, Tajikistan, Azerbaijan, Iraq, Pakistan and others. All these countries are already experiencing a significant shortage of water resources.
In Russia, the total river flow reaches 4.2 thousand km3/year, and, consequently, the provision of resources for this flow per capita is 29 thousand.
m3/year; This is not a record, but quite a high figure. Total fresh water intake in the second half of the 1990s due to the economic crisis had a tendency to some decrease.
In 2000, it was 80–85 km3.
The structure of water consumption in Russia is as follows: 56% goes to production, 21% to household and drinking needs, 17% to irrigation and agricultural water supply, and 6% to other needs.
The same applies to individual economic regions of the country. Thus, in the Central, Central Chernozem and Volga regions, water supply per capita is only 3,000–4,000 m3/year, and in the Far East, 300,000 m3.
The general trend for the whole world and its individual regions is a gradual decrease in water supply, therefore, searches are being made for different ways to save water resources and new ways of water supply.
Introduction
The organization of the rational use of water is one of the most important modern problems of protecting and transforming nature. The intensification of industry and agriculture, the growth of cities, the development of the economy as a whole are possible only if fresh water reserves are preserved and increased. The cost of maintaining and reproducing water quality ranks first among all human costs for nature protection. The total cost of fresh water is much more expensive than any other type of raw material used.
Successful transformation of nature is possible only with sufficient quantity and quality of water. Usually any project of transformation of nature is connected to a large extent with one or another impact on water resources.
In connection with the development of the world economy, water consumption is growing at a rapid pace. It doubles every 8-10 years. At the same time, the degree of water pollution increases, i.e., their qualitative depletion occurs. The volume of water in the hydrosphere is very large, but mankind directly uses only a small part of fresh water. All this, taken together, determines the acuteness of the tasks of water protection, their paramount importance in the whole complex of problems of the use, protection and transformation of nature.
Land water resources and their distribution on the planet. Water supply of the countries of the world
Water occupies a special position among the natural resources of the Earth. The famous Russian and Soviet geologist Academician A.P. Karpinsky said that there is no more precious fossil than water, without which life is impossible. Water is the main condition for the existence of wildlife on our planet. Man cannot live without water. Water is one of the most important factors determining the distribution of productive forces, and very often the means of production. Water resources are the main life-giving resource of the Earth; waters suitable for their use in the national world economy. Waters are divided into two large groups: land waters, waters of the oceans. Water resources are distributed unevenly across the territory of our planet, renewal occurs due to the global water cycle in nature, and water is also used in all sectors of the world economy. It should be noted that the main feature of water is its use directly on the “site”, which leads to a shortage of water in other areas. Difficulties in transporting water to the arid regions of the planet are associated with the problem of financing projects. The total volume of water on Earth is approximately 13.5 million cubic meters, that is, one person has an average of 250-270 million cubic meters. However, 96.5% are the waters of the World Ocean and another 1% are salty underground and mountain lakes and waters. Fresh water reserves are only 2.5%. The main reserves of fresh water are contained in glaciers (Antarctic, Arctic, Greenland). These strategic objects are used insignificantly, tk. Ice transportation is expensive. About 1/3 of the land area is occupied by arid (dry) belts:
North (deserts of Asia, the Sahara Desert in Africa, the Arabian Peninsula);
Southern (deserts of Australia - Great Sandy Desert, Atacama, Kalahari).
The largest volume of river runoff falls on Asia and South America, and the smallest - on Australia.
When assessing water availability per capita, the situation is different:
· the most endowed river runoff resources are Australia and Oceania (about 80 thousand m 3 per year) and South America (34 thousand m 3);
· Asia is the least provided (4.5 thousand m 3 per year).
The world average is about 8 thousand m 3 . Countries of the world provided with river runoff resources (per capita):
· surplus: 25 thousand m 3 per year - New Zealand, Congo, Canada, Norway, Brazil, Russia.
· medium: 5-25 thousand m 3 - USA, Mexico, Argentina, Mauritania, Tanzania, Finland, Sweden.
Little: less than 5 thousand m 3 - Egypt, Saudi Arabia, China, etc.
Ways to solve the problem of water supply:
Implementation of a water supply policy (reducing water losses, reducing the water intensity of production)
attracting additional fresh water resources (desalination of sea waters, construction of reservoirs, transportation of icebergs, etc.)
· construction of treatment facilities (mechanical, chemical, biological).
Three groups of countries most endowed with water resources:
· more than 25 thousand m 3 per year - New Zealand, Congo. Canada, Norway, Brazil, Russia.
· 5-25 thousand m 3 per year - USA, Mexico, Argentina, Mauritania, Tanzania, Finland, Sweden.
· less than 5 thousand m 3 per year - Egypt, Poland, Algeria, Saudi Arabia, China, India, Germany.
Water functions:
drinking (for humanity as a vital source of existence);
· technological (in the world economy);
transport (river and sea transportation);
Energy (HPP, PES)
Structure of water consumption:
Reservoirs - about 5%
communal and household services - about 7%
industry - about 20%
· agriculture - 68% (almost the entire water resource is used irretrievably).
Several countries have the greatest hydropower potential: China, Russia, USA, Canada, Zaire, Brazil. The degree of use in the countries of the world is different: for example, in the countries of Northern Europe (Sweden, Norway, Finland) - 80 -85%; in North America (USA, Canada) - 60%); in Foreign Asia (China) - about 8-9%.
Modern large thermal power plants consume huge amounts of water. Only one station with a capacity of 300 thousand kW consumes up to 120 m 3 /s, or more than 300 million m 3 per year. Gross water consumption for these stations in the future will increase by about 9-10 times.
Agriculture is one of the most significant water users. It is the largest water consumer in the water management system. For the cultivation of 1 ton of wheat, 1500 m 3 of water is required during the growing season, 1 ton of rice - more than 7000 m 3. The high productivity of irrigated land has stimulated a sharp increase in the area worldwide - it is now equal to 200 million hectares. Making up about 1/6 of the total area under crops, irrigated lands provide about half of agricultural production.
A special place in the use of water resources is occupied by water consumption for the needs of the population. Domestic and drinking purposes in our country account for about 10% of water consumption. At the same time, uninterrupted water supply, as well as strict adherence to scientifically based sanitary and hygienic standards, are mandatory.
The use of water for economic purposes is one of the links in the water cycle in nature. But the anthropogenic link of the cycle differs from the natural one in that in the process of evaporation, part of the water used by man returns to the desalinated atmosphere. The other part (component, for example, in the water supply of cities and most industrial enterprises 90%) is discharged into water bodies in the form of wastewater contaminated with industrial waste.
The World Ocean is a storehouse of mineral, biological and energy resources. The oceans are the richest part of the planet in terms of natural resources. Significant resources are:
mineral resources (iron-manganese nodules)
energy resources (oil and natural gas)
biological resources (fish)
sea water (table salt)
The mineral resources of the bottom of the World Ocean are divided into two groups: shelf resources (coastal part of the ocean) and bed resources (deep water areas of the ocean).
Oil and natural gas are the main types of resources (more than half of all world reserves). More than 300 deposits have been developed and their intensive use is underway. The main offshore oil and natural gas production areas are 9 main offshore areas:
Persian Gulf (Kuwait, Saudi Arabia)
South China Sea (China)
Gulf of Mexico (USA, Mexico)
Caribbean Sea
North Sea (Norway)
Caspian lake
Bering Sea (Russia)
Sea of Okhotsk (Russia)
The World Ocean is rich in reserves of such an amazing mineral as amber, which is mined on the coast of the Baltic Sea, there are deposits of precious and semi-precious stones: diamonds and zirconium (Africa - Namibia, South Africa; Australia). Known places for the extraction of chemical raw materials: sulfur (USA, Canada), phosphorites (USA, South Africa, North Korea, Morocco). In deep-sea areas (ocean bed), iron-manganese nodules are mined (Pacific Ocean, Indian Ocean).
The energy resources of the World Ocean are expressed in the use of sea tides. Tidal power plants are built on the coast of those countries, the “ebb and flow” mode is carried out daily. (France, Russia - White, Okhotsk, Barents Seas; USA, Great Britain).
The biological resources of the World Ocean are diverse in species composition. These are various animals (zooplankton, zoobenthos) and plants (phytoplankton and phytobenthos). The most common are: fish resources (more than 85% of the used biomass of the ocean), algae (brown, red). More than 90% of fish is caught in the shelf zone in high (Arctic) and temperate latitudes. The most productive seas are: the Norwegian Sea, the Bering Sea, the Sea of Okhotsk and the Sea of Japan. The reserves of sea water are large. Their volume is 1338 million km3. Sea water is a unique resource of our planet. Sea water is rich in chemical elements. The main ones are: sodium, potassium, magnesium, sulfur, calcium, bromine, iodine, copper. There are more than 75 of them in total. The main resource is table salt. The leading countries are: Japan and China. In addition to chemical elements and microelements, silver, gold and uranium are mined in the depths of sea waters and on the shelf. The main thing is the fact that sea water is successfully desalinated and consumed in those countries that lack fresh inland water. It should be noted that not all countries of the world can afford such a luxury. Desalinated sea water is intensively used by Saudi Arabia, Kuwait, Cyprus, and Japan.