The e-commerce market in Russia. Online store statistics. Regional distribution of the activity of Russian buyers in the e-commerce market. Internet commerce growth forecast
In November 2016, RBC market research analysts conducted a large-scale study of the e-commerce market in Russia. They analyzed the main indicators of the industry, conducted a sociological survey among 3,000 online shoppers from all over Russia. The study provides an analysis of the survey results, assessments of the state of the Russian e-commerce market and trends for 2016-2017.
Rusbase gives the main theses of the report. More details: follow the link.
Other RBC reports Market Research: .
In nominal terms, for 9 months of 2016, the growth in the turnover of retail trade in food and non-food products amounted to only 2.4%. Real growth, which takes into account consumer inflation, went negative and amounted to -5.3%. In the context of the crisis and falling consumer demand, the e-commerce market managed to show a positive trend - about 6%. The non-food retail sector did the best - it managed to increase its share in the total turnover from 3.8% in 2015 to 4.2% in 2016.
According to RBC Market Research, in 2016 the turnover of the entire market (excluding sales of coupons for discounts) will amount to 944.3 billion rubles, which is 5.8% higher than in 2015.
Dynamics of the volume of the B2C segment of the Russian e-commerce market in 2009-2016, billion rubles, %
Every year, cross-border trade occupies an increasing share in the structure of the commodity segment of the Russian e-commerce market. Foreign online stores seek to "beat" Russian companies due to lower prices and an expanded range of goods. This intensifies competition in an already highly competitive market. The increase in the presence of foreign players in the e-commerce market has been worrying both top domestic online retailers and the regulator for several years now.
In October 2016, the Federal Customs Service proposed lowering the threshold for duty-free importation of goods from foreign online stores into Russia, and in December, the Ministry of Finance announced that cross-border online trade should be subject to the same taxes and duties as offline retail. Against this background, foreign online stores are trying to minimize possible damage - for example, some are already granting Russian online projects the right to place goods on their websites, which allows expanding the range of cross-border players and increasing the number of buyers of Russian online stores.
Services are bought less and less
Another large segment of Russian Internet commerce (paid Internet services) is inferior to other sectors both in terms of development rates and in terms of market share. If in 2014 paid Internet services occupied 14.1% of the e-commerce market, by 2016 their share had dropped to 11.8%. In monetary terms, the segment of paid services did not undergo significant changes: in 2014 it amounted to 113.7 billion rubles, and in 2016 its turnover did not exceed 111.0 billion rubles.
Consumers seek savings
According to the results of RBC Market Research surveys, the vast majority of Russian online shoppers have made purchases at least once using . However, 6 out of 10 respondents try to shop online less frequently. 37% of online shoppers reported that over the past year (November 2015 to November 2016) their spending on goods and services online has decreased. For 26%, according to the survey, the costs have not changed, and for 25% of respondents, they have increased.

Dynamics of changes in spending on purchases in online stores, 2015-2016, % of respondents who made purchases in online stores
At the same time, one in four respondents in 2016 increased their spending on online purchases compared to last year. In particular, 50% of respondents began to make online purchases more often, and 11% began to buy more expensive goods and services. However, more than half of the respondents link this directly to rising prices. Also, the increase in prices is one of the reasons for the positive dynamics of the e-commerce market.
Compared to the previous year, the number of respondents who noted the increase in prices decreased from 69% to 57%. At the same time, the share of those who began to buy more often increased by 10%. Despite the slowdown in price growth, it is still noticeable for the majority of Russians. This, however, does not affect the demand in the e-commerce market - it continues to increase.

Dynamics of changes in the reasons affecting the increase in expenses, 2015-2016, % of respondents who increased expenses on the Internet
Delivery is losing popularity, and almost everyone is interested in discounts
Over the past two years, there has been a growing number of consumers who prefer the pickup feature to other online shopping models. In 2016, it was 53.9%.
There are two reasons for this: firstly, online stores are expanding their network of distribution points (and not only in large cities, but also in the regions), and secondly, buyers are trying to save money during a crisis. Order with subsequent delivery, in turn, loses popularity for two years. The most unpopular option is to order and pick up at the nearest retail store (because few retailers implement a multi-channel development strategy).
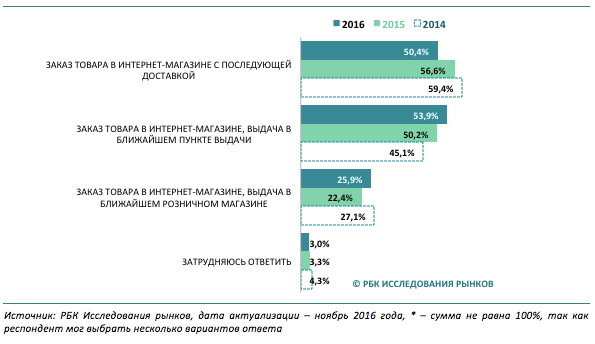
“Which ways of buying goods via the Internet are the most PREFERRED for you?”, 2014 – 2016*, % of respondents who made purchases of goods in online stores
Properly conducted sales will help to increase traffic and increase the conversion of online stores: in 2016, 91% of respondents began to pay attention to promotions and special offers.
Buyers trust cards, but not electronic money
From 2010 to 2016, the proportion of online shoppers paying with cash dropped from 70% to 46%. 70% of buyers prefer payment by plastic cards. Services are losing popularity - WebMoney, Yandex Money, RBK Money. However, thanks to integration into mobile, they managed to reverse the negative trend of recent years – in 2016, the share of buyers using electronic wallets increased from 12% to 17%. International electronic payment systems (QIWI, PayPal and others) are popular with another 15% of online shoppers.
Today, to open your online store, you no longer need special knowledge and experience. The number of suppliers is increasing and is not limited to China, and companies have appeared at the service of retailers that take care of everything - from the formation of an assortment to packaging and sending parcels (the so-called).
Not surprisingly, the number of people willing to engage in e-commerce has increased. But far from everyone succeeds: on 200,000 sites with signs of an online store, only 80,000 have traffic of more than 20 people a day.
In this article, we analyzed the statistics of online stores based on research materials for 2015-2016 and collected the most revealing facts, the knowledge of which will help you choose the right course when developing your online business.
Statistics of sales of goods in Russia and abroad - differences and features
The most noticeable difference between Russian retail and European and American retail is the disproportionately large number of sellers and buyers in Moscow compared to other regions. In the second half of 2016, the volume of the e-commerce market for Moscow was more than 60%. 
Another difference is a large share of delivery of goods by self-delivery. This phenomenon has at least two reasons: the underdevelopment of delivery services, especially in the regions, and the desire of the buyer to save on delivery, especially if the amount of the check is small.
The next feature that researchers note when analyzing the Internet market is that cash payments for goods prevail in Russia.

In 2017, cash still dominates.
This should be taken into account by retailers when choosing payment methods. Your delivery service should have a well-established cash on delivery scheme, and the courier should be chosen taking into account the fact that he will have to deal with money, checks and invoices.
Rating of online stores - TOP-10 most successful
The giants of the e-commerce market, such as Ozone and Eldorado, have been in the lead for several years now. In the TOP-100 and even in the TOP-200 of online stores over the past two years, no new names have been added.
Here are the top ten stores with the highest sales volumes in 2016. If you want to get closer to the leaders in terms of profit, number of customers and other indicators, take an example from them.
1. ULMART.RU - department store. Turnover - 36,800 million rubles per year. Number of orders per year - 7360 000. Average check - 5000 rubles.
2. WILDBERRIES.RU - clothing, footwear and accessories store. Turnover - 32,800 million rubles per year. Number of orders per year - 17,000,000. Average bill - 1900 rubles.
3. CITILINK.RU - department store. Turnover - 20,400 million rubles per year. Number of orders per year - 1,570,000. Average check - 13,000 rubles.
4. MVIDEO.RU - hardware and electronics store. Turnover - 36,800 million rubles per year. Number of orders per year - 7,360,000. Average check - 5,000 rubles.
5. EXIST.RU - auto parts store. Turnover - 17,300 million rubles per year. The number of orders per year is 6,650,000. The average check is 2,600 rubles.
6. ELDORADO.RU - electronics and technology store. Turnover - 16,900 million rubles per year. Number of orders per year - 2,090,000. Average bill - 8100 rubles.
7. SVYAZNOY.RU - electronics and technology store. Turnover - 16,700 million rubles per year. Number of orders per year - 1,720,000. Average bill - 9400 rubles.
8. KUPIVIP.RU - clothing, footwear and accessories store. Turnover - 16,600 million rubles per year. Number of orders per year - 1,770,000. Average bill - 9400 rubles.
9. OZON.RU - department store. Turnover - 15,200 million rubles per year. Number of orders per year - 5,180,000. Average bill - 2900 rubles.
10. KOMUS.RU - office goods store. Turnover - 12,900 million rubles per year. Number of orders per year - 1,250,000. Average check - 10,300 rubles.
These companies account for about 30% of the Internet commerce market in Russia.

When forming the rating, the average check amount, the number of orders per year, site usability, the quality of the mobile version of the store, and SEO optimization indicators are also taken into account.
Statistics of goods sold: what sells better on the Internet
According to data for 2014-2015, household appliances (43% of orders), clothing and footwear (17% of orders), auto parts (10% of orders) were sold best on the Internet.

A fragment of a study on online sales statistics for 2015.
Now the trend of attendance of different categories of online stores is “flattening out”. The leaders mentioned above in terms of demand are no longer developing so rapidly, they are “catching up” with children's goods, food, goods for animals, for construction and repair.
Research of online stores and their audience
Previously, we have already published their audiences. According to the results of a new survey at the end of 2016 among users over 18 years old (1,600 people from 137 cities of the Russian Federation took part in the survey), only 38% of respondents are not going to buy anything on the Internet. 14% of respondents do not yet have experience of online shopping, but want to try, 31% have already bought something a few times, 15% use the services of online stores regularly.
71% of the respondents are residents of Moscow, 61% are people aged 18 to 24. 62% of respondents are people with a good income - they believe that they can afford to buy durable goods.

These data roughly coincide with the analytics of online stores - the giants of their industries. They agree that more than 90% of the profit is brought by residents of Moscow and the Moscow region aged 18 to 40 with an average income.
Data Insight conducted an analysis of the market of online stores and buyers. As a result of the study, the following conclusions were made:
34% of respondents buy goods online because it saves time.
28% choose to shop online because they can read product descriptions and take their time making a choice.
22% prefer online for more affordable prices.
11% believe that on the Internet you can find new and rare goods that are not available online.
Make your online store in such a way as to save the buyer's time, create an interesting assortment, write meaningful product descriptions, set attractive prices and implement loyalty programs. So you are more likely to become popular with buyers.
Average online store conversion: top 10 most converting products
Conversion rates are influenced not only by the profitability of the offer, the quality of the site and the relevance of the audience. It is also necessary to take into account the specifics of the product - it determines the audience, the conditions under which the decision to purchase is made, and other features that do not depend on advertising and sales managers.
The average conversion of online stores of different product groups according to the study Online Store Base:
Food delivery - 14.9%
Event tickets - 7.8%
Books - 3.6%
Intimate goods - 3.4%
Cosmetics, perfumery - 3.2%
Food - 3.1%
Medicine - 3.0%
Tires and wheels - 2.9%
Goods for children, toys - 2.8%
Hobbies and needlework - 2.5%.
The most non-convertible product groups are musical instruments (0.8%) and alcohol (0.6%).
E-commerce forecasts: what to expect in the future
In 2016, the growth of online shoppers slowed down a bit compared to previous years. But market volumes continue to grow due to an increase in the frequency of purchases. People gain experience with shops and online payments, they always have access to the Internet (almost everyone has a smartphone in their pocket), courier deliveries expand their geography and improve the quality of services.
Given these favorable growth factors, we can make the following forecast for e-commerce statistics in Russia:

The key observation that ecommerce analysts make is something like this: every year the e-commerce market changes faster and faster. Therefore, it is important to follow trends, think through your actions five steps ahead and take into account global growth trends, which will not stop soon.
The Russian e-commerce market will exceed 1 trillion rubles this year, but the impressive growth rates of foreign online stores, primarily Aliexpress, threaten to turn it into an international platform for duty-free shopping. AKIT warns that in two years "there will be nothing left of Russian Internet commerce at all, we will sell only Chinese goods"
The volume of the e-commerce market in Russia in 2016 grew by 21% compared to 2015 and amounted to 920 billion rubles, according to a study by the Association of e-commerce companies (AKIT). According to forecasts, in 2017 the market volume will exceed 1.1 trillion rubles.
The volume of the cross-border trade market (crossborder, purchases in foreign online stores) at the end of the year increased by 37% compared to 2015 and amounted to 301.8 billion rubles, which is 33% of the entire r-commerce market in Russia. Thus, the share of cross-border trade increased by 4 p.p. In 2017, according to ACIT forecasts, the volume of cross-border trade will exceed 400 billion rubles.
Alie offensive
The number of incoming international shipments with a commodity investment continues to grow at a tremendous pace, emphasizes in ACIT. In 2016, their number increased by 102% (at the same time, the number of orders in the domestic market grew by only 6%) and amounted to 233 million items. AKIT revives that in 2017 the number of incoming shipments with a commodity investment will be about 400 million pieces.
Russians buy most of the goods in foreign online stores in China. The share of shipments from this country is 90%, from the European Union - 4%, the USA - 2%. At the same time, in monetary terms, China is 52%, the European Union 23%, the United States - 12%. This indicates a low average check for purchases in China, the Association explains.
“Today, hundreds of millions of goods enter the territory of the Russian Federation duty-free and tax-free. Unfortunately, there is a lack of a small but strategic effort that would move the situation off the ground. At the same time, we see that the crossborder occupies more than 40% of the share in Russia. Two more years will pass, and there will be nothing left of Russian Internet commerce, we will sell exclusively Chinese goods, and for China, Russia will become a market for duty-free trade on our territory," the head of ACIT notes.
In general, more than 64% of purchases (transactions) in foreign stores do not exceed 22 euros in value. More than 96% - do not exceed 150 euros in value. Among all stores selling in Russia, Aliexpress has the largest audience (the number of unique visitors who visited the store page in January 2017) - more than 22 million people.
Russian e-commerce market by segments, % of total revenue)
Source: AKIT
Mail by 62%
In 2016, in the e-commerce delivery market (including shipments from foreign online stores and delivery on the domestic market), 62% of buyers used the Russian Post service, which is 11 percentage points higher than in 2015 - 51%.
In 2016, the Russian Post processed 225 million international items with commodity investments, which is almost 2 times more than the figure for the previous year - 128 million items. In general, the Russian Post processed 296 million postal items with a commodity investment (total: domestic and foreign), which is more than 1.5 times higher than last year's figure - 194 million pieces.
"More and more buyers and online stores are choosing the Russian Post as a reliable and fast delivery channel, voting for us in rubles. And for the convenience of recipients, we continue to launch convenient services on the "last mile" so that the process of sending and receiving parcels takes minimal time", - notes the deputy head of the Russian Post for the parcel business Sergey Malyshev.
The largest regions in terms of the share of online commerce are Moscow, the Moscow Region and St. Petersburg. The regions with the highest growth rate of cross-border trade in 2016 compared to 2015 were, in particular, the Republic of North Ossetia-Alania - 68.3% and the Ivanovo Region - 65.5%. In Moscow, cross-border trade grew by 36%, and in St. Petersburg by 37.7%.
Online purchases by Russians abroad by region, % of total spending
Source: AKIT
Electronics and wardrobe
Russia is the largest country in Europe in terms of the number of Internet users - 84 million people, but the penetration rate remains at 70.4% and has not increased over the past year. Most Internet users are in the age group from 16 to 29 years old - 97%. Among people over 55 years old - only 28%. In many respects, the low level of Internet penetration in Russia and the lack of growth are associated with the low share of users among people over 55 years old, ACIT states.
The most popular product categories, both on the local market and on the cross-border market, are electronics and household appliances, clothing and footwear. At the same time, the share of clothing and footwear in the local market is 22%, while in the cross-border market it is 36%. Also popular categories are products for cars, perfumes and cosmetics, sporting goods and others.
The local market of Internet trade in household appliances and electronics (H&E) in 2016 grew by 17% and amounted to 208 billion rubles. According to ACIT forecasts, in 2017 the market volume will be about 240 billion rubles. The share of e-commerce in the H&E market is 17.9%, which is high by international standards. The best-selling product categories are computers and laptops - 28% and phones and smartphones - 22%. In 2016, there is again a trend of growth in the regions more accelerated than in the central region, which indicates a gradual return of consumer activity.
“Today, we are seeing encouraging trends in consumer accumulation, which should develop into a recovery in consumer activity a little later. But the market of 2016 and 2017 is still a price market, which is the main criterion for choosing a buyer. Therefore, once again, retailers should not forget about optimization of operating costs, the reduction of which will allow us to remain competitive in these realities," says Mikhail Slavinsky, CEO of the electronic discounter.
Hello!
We talk about the latest relevant research on the Russian e-commerce market. Analysts found out where and how e-commerce is moving in 2018, and also identified the main trends in the online market for home and renovation goods.
Growth in sales volumes, drop in average check
Fedor Virin, an expert in Internet research and Internet marketing, founder of the Data Insight research agency, presented the report "Internet commerce in Russia 2018". First, the good news: the volume of domestic online sales of physical goods continues to grow at a fairly decent pace. In 2018, according to forecasts, the increase will be 18%, the market size will reach 1.115 billion rubles.
For comparison: market growth in 2017 was 18%, in 2016 - 23%.
However, the size of the average check for online sales has been falling since 2014. In 2017, the drop was 3%. The growth in the number of orders in 2017 was the same as in 2016 - 22%.

According to the expert's forecasts, in 2018 the negative dynamics of the average check will continue (this is especially true for stores with a rapid increase in the number of orders).
What sold best in online stores?
The leaders are electronics and appliances, clothing, footwear and accessories, as well as household and repair goods.

The most dynamic growth in terms of online sales in 2017 was shown by goods for home and repair (plus 35% compared to 2016), food (plus 31%), electronics and appliances (plus 30%), beauty and health (plus 29% ), books and goods for children (plus 27%), clothes, shoes, accessories (plus 26%).
It can be assumed that this trend will continue in 2018.
But auto parts, on the contrary, began to buy online less: the drop in sales was 12%.
Main export directions from Russian online stores - Europe and far abroad (68%), as well as the CIS countries.

Interestingly, the lion's share - 40% of export goods - belongs to the fashion category. According to analysts, foreign buyers choose inexpensive and high-quality textiles. Also in the trend of Russian goods are goods for the home and interior.

The main trends in the logistics market for online stores:
- Growth of spontaneous online purchases, including through smartphones.
- Growing food delivery.
- Significant investments in marketplaces.
- The value of technology for logistics, IT technologies and processes.
- Demand for special shipping and oversized.
- PVZ and postamats are gaining popularity.
- The fulfillment market is waiting for new customers.
The share of online purchases from mobile phones is growing. For young people under 25 years old, this is the "number 1 device" for orders in the online store. It is interesting to study the dependence of "mobile" purchases on the age of buyers.

In general, to the question: “How exactly did you make the last purchase in the online store?” 13.4% of users answered “Ordered from a smartphone through the website”, and 12.3% ordered through a mobile application.
The share of those who make purchases from a desktop computer was 30.2%, from a laptop - 32.4%. They admitted that it is more convenient for them to choose a product and place an order from the “big screen”.
For home and renovation: high average bill, sales growth
Another study conducted by Data Insight in conjunction with Robokassa concerns the online home improvement and renovation market, the category with the highest growth in sales.
During the year, from June 2016 to June 2017, 7.6 million orders worth 83.4 billion rubles were placed in the top 1000 online stores for household goods and repairs. The average check was 11 thousand rubles. This is the highest rate of all product categories.
6% of all online orders of the 1000 largest stores in the first half of 2017 were made in online stores of household goods and repairs. Since the average check was quite high, the share in terms of revenue was twice as high - 12%.
The conversion rate in the home improvement and renovation sector was 2%. The nearest indicators are sporting goods stores and gift and jewelry stores.

Interesting data: the share of transitions to online stores of household goods and repairs through a search engine is higher than the average for all categories of online stores.
- 43% of users come to the stores of the segment through organic search.
- 18% - direct transitions.
- 16% - via links.
- 11% - paid search.
- 6% - Email.
- 3% each - social networks and media advertising.
To visit online stores of household goods and repairs, buyers more often use desktop computers and laptops. 46% of traffic on these sites comes from smartphones and tablets.
IKEA's most popular app with over 5,000,000 installs on Google Play. The share of online stores of goods for home and repair with applications in Google Play is 17%, in the App Store - 12%.

The peak of activity of placing online stores of goods for home and repair on Yandex.Market came in 2016: 80 stores were placed on the platform. About 10 stores appeared this year.
In 2017, the number of placed stores fell to 78, while the number of new placements fell to 2.
The average rating for the sum of all reviews on Yandex.Market as of November 2017 was 4.8: buyers left 155,000 reviews.
34% of Vkontakte online stores have more than 10,000 subscribers. On Facebook, the same figure is 10%, on Instagram - 16%, on YouTube - 7%, on Odnoklassniki - 13%.
And another very interesting point.
47% of online stores in the home and renovation sector use CMS of their own design.
Bitrix is used by 27% of online stores, 26% use other CMS.
More than half (57%) of online stores do not send out news about their events and promotions. The most popular service among those who use email newsletters is Unisender (7%). The remaining 37% use other services.
4.9 (97.33%) 15 votes
The Association of e-commerce companies (AKIT) together with admitad conducted an analysis of the development of the e-commerce market in Russia in 2016. How is online trade developing in the regions of the country, which products are leaders in orders using smartphones, and which, on the contrary, are more convenient for customers to purchase using a PC?
The volume of the e-commerce market in Russia in 2016 amounted to 920 billion rubles and grew by 21% compared to 2015. At the same time, the local e-commerce market amounted to 618 billion rubles in 2016 and grew by 14.4% compared to 2015. The cross-border trade market at the same time grew by 37.7% in 2016 compared to 2015 and amounted to 302 billion rubles (33% of the Internet trade market in the Russian Federation). Thus, the cross-border trade market is growing significantly faster than the local e-commerce market.
Volumes of e-commerce in the regions of Russia
In 2016, the regions showed high growth (at or above the level of the Central Federal District). The Central Federal District remains the largest in terms of e-commerce turnover, the volume of local e-commerce in it amounted to 290.8 billion rubles and showed an increase of 6.3%. The volume of the cross-border trade market in the Central Federal District amounted to 153.3 billion rubles in 2016 and grew by 37.1% compared to 2015. The difference in the growth rates of local and cross-border trade is even more visible in the CFD.
Next in terms of the size of the e-commerce market are the following regions: NWFD (The volume of the local market in 2016 is 88.3 billion rubles, an increase of 20.8%, the volume of the cross-border market in 2016 is 46.9 billion rubles, an increase of 37.1% ), Volga Federal District (the volume of the local market in 2016 is 84.2 billion rubles, an increase of 36.3%, the volume of the cross-border market in 2016 is 29.8 billion rubles, an increase of 39.8%), the Southern Federal District (the volume of the local market in 2016 - 46.1 billion rubles, an increase of 34.9%, the volume of the cross-border market in 2016 - 13.1 billion rubles, an increase of 50.5%), etc. In general, it is observed that in all regions the cross-border trade market is growing significantly more than at a high rate than the local trading market.
E-commerce market in the Central Federal District amounted to 444 billion rubles and showed an increase of 15.3%, which is lower than the growth of the entire market, thus the Central Federal District reduced its share in the total volume of the e-commerce market in the Russian Federation from 50.7% to 48.2%. The share of cross-border trade in the Central Federal District is 34.5%. Thus, the share of cross-border trade is higher than the average for the Russian Federation (33%). The volume of e-commerce in Moscow is 299 billion rubles (67% of the volume in the Central Federal District). The volume of e-commerce in the Moscow region is 69 billion rubles (15.5% of the volume in the Central Federal District). In general, Moscow and the Moscow region account for about 83% of the volume of Internet commerce in the Central Federal District.
E-commerce market in the Northwestern Federal District amounted to 135 billion rubles and showed an increase of 25.4%, which is slightly higher than the growth of the entire market of the Russian Federation, thus the Northwestern Federal District increased its share in the total volume of the e-commerce market in the Russian Federation from 14.2% to 14.7%. The share of cross-border trade in the NWFD is 34.7%. Thus, the share of cross-border trade is higher than the average for the Russian Federation (33%). The volume of e-commerce in St. Petersburg is 86 billion rubles (64% of the e-commerce market in the Northwestern Federal District). The share of the Leningrad region is insignificant.
E-commerce market in the Siberian Federal District amounted to 62.5 billion rubles and showed an increase of 26.2%, which is slightly higher than the growth of the entire market of the Russian Federation, thus the Siberian Federal District increased its share in the total volume of the e-commerce market in the Russian Federation from 6.5% to 6.8%. The share of cross-border trade in the Siberian Federal District is 35.9%. Thus, the share of cross-border trade in the region is higher than the average for the Russian Federation (33%).
E-commerce market in the Southern Federal District amounted to 59.2 billion rubles and showed an increase of 38.1%, which is much higher than the growth of the entire market of the Russian Federation, thus the Southern Federal District increased its share in the total volume of the e-commerce market in the Russian Federation from 5.6% to 6.4%. However, the share of cross-border trade in the Southern Federal District is lower than the average for the Russian Federation (33%) and amounts to 22.1%. This is largely due to the active growth of Krasnodar and Sochi, as well as the expansion of local players in this market.
E-commerce market in Volga Federal District amounted to 114 billion rubles and showed an increase of 37.2%, which is much higher than the growth of the entire market of the Russian Federation, thus the Volga Federal District increased its share in the total volume of the e-commerce market in the Russian Federation from 10.9% to 12.4%. The share of cross-border trade in the Volga Federal District is 26.1%. We see that the share of cross-border trade is also lower than the Russian average (33%). The region is growing due to the growth of the Republics of Bashkortostan, Tatarstan, Nizhny Novgorod and Samara regions.
Alexey Fedorov, President of AKIT:“In general, we can say that in 2016 the regions began to grow faster than the Central Federal District, which even lost its share in dynamics. This is due, first of all, to the restoration of the purchasing power of the regions. The growth of regional indicators in 2016 is a very good trend, and we hope that it will continue further. The development of regions at a faster pace than the growth of the Central District, from the point of view of the young market, is a natural process. The delivery of goods is being optimized, online players are entering the regions. At the same time, Moscow and St. Petersburg are now oversaturated. Therefore, by all laws, the regions should grow faster.
Among the regions, the clear leaders are the Volga Federal District and the Southern Federal District, which, at the same time, have a lower share of cross-border trade than in Moscow and St. Petersburg. Firstly, this is due to the fact that these developing regions receive a large amount of investment (in particular, in Sochi, Krasnodar, Kazan). Large local players also pay attention to them, due to this there is an increase. And the Russian Post quickly delivers goods in a short time. Things are not as bad with local players as in Moscow and St. Petersburg, and this is a very positive trend.
We see that Moscow and St. Petersburg are major centers that pull the regions over. They are indicators of the development of the online trading market in Russia as a whole, setting its trend. At the same time, the Moscow region is a huge region, which also matters and forms the picture of the Central Federal District. It's a huge market and a large number of cities."
Alexander Bachmann, CEO admitad:“After Moscow, St. Petersburg and the Moscow Region comes the Krasnodar Territory, and then the Sverdlovsk Region. Online stores are entering the regions due to lower competition for the buyer compared to Moscow and St. Petersburg. At the same time, they benefit from the payment scheme for the target action, as it is understandable, transparent and predictable.”
Ordering methods in online stores and product categories
As before, in Russia, people often place orders on the Internet using stationary computers or laptops (desktop). At the same time, 14% of orders were made from the mobile channel in 2016. According to the operating systems from which an order is made (if we take only IOS and Android, the share of other systems is not significant), there is almost equality: 51% of people place orders using smartphones based on IOS, 49% place orders using smartphones based on android.

Interestingly, most orders from mobile phones are made in the category "goods for children" - 30%. This situation is most likely due to the fact that people need to make a quick choice of goods and at the same time purchases are made quite regularly.
The share of mobile sales is also high in the category "beauty and health" - 24% and "household appliances and electronics" - 16%. This can be attributed to the fact that people are used to buying these categories on the Internet and are ready to place orders from smartphones.
The least orders from mobile phones are in the categories "Food, groceries" - 5%, "furniture and household goods" - 9%, "garden equipment" - 8%. In categories where people need to spend a longer time to select and order, it is more convenient to use a desktop, since it is much more convenient to study information and compare products on a large screen of a desktop computer.
Alexander Bachmann, CEO admitad believes that “the dynamics of purchases in each of the e-commerce segments has its own dependence. Invariably, e-commerce as a whole reaches its peak in terms of turnover in November before the New Year holidays. The peak of purchases from mobile devices in 2016 was in December, and from desktop computers - in November.
During the year, purchases from iOs (iphone and ipad) kept the lead in the average check from a purchase, then purchases from the Android platform gave way to it. In third place with an average check during the year are stationary computers. In general, during 2016, mobile devices are leading in terms of average basket check compared to desktop.
Desktop users on average take about one day to make a purchase decision, while mobile users take about two days.”
Alexey Fedorov, President of AKIT attributes the growth in the volume of e-commerce in many categories, primarily to the fact that the frequency of purchases in them is quite high.
“On average, for example, goods for children are purchased once a month. In the cosmetics category, the average number of orders per month is 7, in the category of children's goods - 5, and in the DIY segment, the frequency can be no more than once a year. And people change refrigerators every 15 years. Also, no more than once a year, consumers buy furniture, goods for the garden and summer cottages are popular only on the eve of the summer season. Installing a mobile application in these categories is not a priority, because, according to statistics, an application that is used no more than once a month is deleted by the user.”
Prepared based on materials from ACIT and admitad